Chart Of The Week   March 01 2023

How To Spot An Equity Market Bottom

The indicators that BCA Research’s Global Asset Allocation service has identified as reliable guides to bear market troughs do not suggest it is time to overweight equities in a multi-asset portfolio.

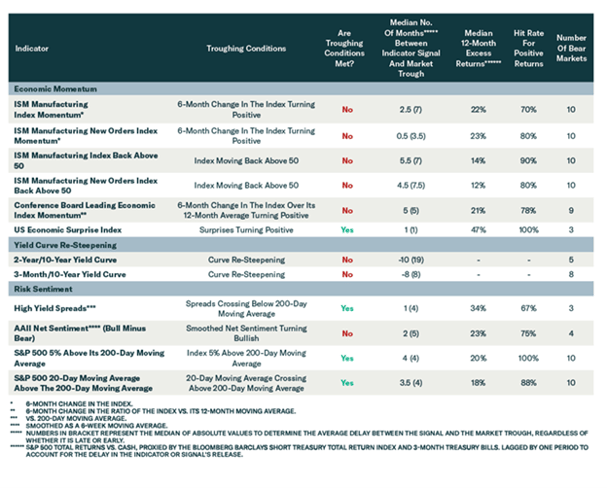
This has been a difficult 12 months for investors: After the huge sell-off last year, risk assets have rebounded since October. So, is that the beginning of a new bull market, or just another bear market rally? How can investors tell the difference?

To answer the question, the team analyzed past bear markets in the US going back to the 1950s to identify indicators which have reliably signaled the end of the bear market. They detail 12 economic, financial, and technical indicators that investors can use to identify bear market troughs.

Although no single indicator is infallible, a combination of indicators can be used to create a useful checklist to help identify equity market bottoms. Among economic indicators, the team finds that a reversal in economic momentum is the most reliable. Among market indicators, a re-steepening of the yield curve and a significant decline in credit spreads are the most reliable signals. They would also recommend incorporating sentiment indicators pointing to a recovery in risk appetite, and stock market momentum.

Currently, their checklist of indicators does not clearly signal a bear-market bottom or that it is time to overweight equities in a multi-asset portfolio. Out of the four indicators generating buy signals, two of them are strictly technical or sentiment based. Given the unique character of the current business cycle, they recommend investors wait for the more fundamental indicators to send buy signals before allocating more risk to equities. As such, the Global Asset Allocation service continues to recommend an underweight on equities, overweight on fixed income, and neutral on cash.